Key answer
Your numbers do not match because each team pulls from its own source with its own definitions, then exports to spreadsheets by hand. The fix is a governed single source of truth: agreed metric definitions, one trusted data layer, controlled pipelines, and governance so every report draws from the same numbers.
Your numbers do not match because each team pulls from its own source, defines metrics its own way, and exports to spreadsheets by hand. Nothing is governed, so every report is a slightly different version of the truth. The fix is not another dashboard. It is a governed single source of truth: agreed definitions, one trusted data layer, controlled pipelines, and an owner, so every report draws from the same numbers.
The cost of numbers people do not believe#
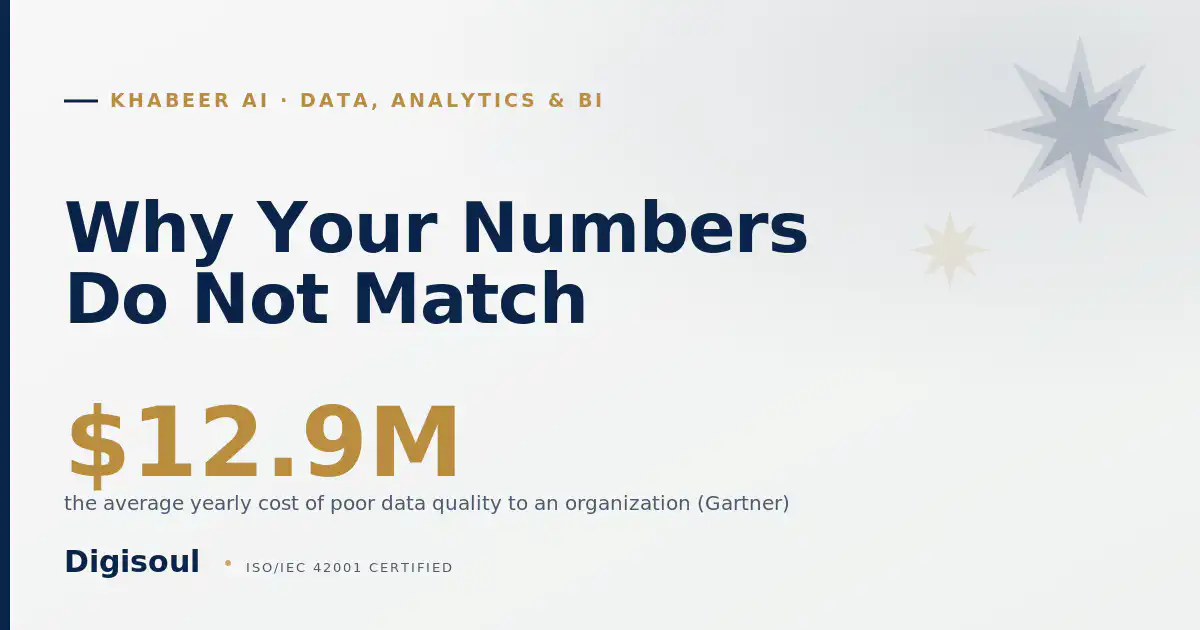
When two reports disagree in a meeting, the discussion stops being about the decision and starts being about whose number is right. That tax is real and recurring. Gartner estimates poor data quality costs organizations an average of about $12.9 million a year, and that figure does not capture the slower decisions and lost trust that follow. AI is raising the stakes: dbt Labs’ 2026 survey found the priority on increasing trust in data jumped from 66% to 83% in a single year, while 71% now worry about incorrect or hallucinated outputs reaching stakeholders.
the average yearly cost of poor data quality to an organization
now rank increasing trust in data their top priority, up from 66% a year earlier, as AI ships faster than trust
Why the numbers disagree#
It is almost never one cause. It is four, working together.
Why the numbers disagree
Different source systems, different definitions of the same metric, manual exports that diverge the moment they are saved, and no governance to say what the number officially is. Add a new BI tool on top of this and you have a fifth version of the truth, not a single one.
The fix, in four moves#
A single source of truth is built, not bought.
The fix, in four moves
You agree metric definitions, consolidate into one trusted data layer, control the pipelines with quality checks and clear ownership, then serve BI that draws from that source. The dashboards come last, on purpose, because a dashboard on ungoverned data just spreads the disagreement faster. Once the source is trusted, real-time reporting becomes safe, see Real-Time BI.
How Khabeer helps#
Khabeer’s Data, Analytics and BI practice builds the single source of truth and real-time BI on top of it, independent and vendor-neutral, with data strategy, governance, and architecture under one accountable partner. In one illustrative example (hypothetical, not a real client), an organization replaces four conflicting reports with one governed layer, and meetings go back to being about the decision. The first step is a short conversation about which numbers your teams argue over.
Key takeaways
- Numbers conflict because of many sources, different definitions, manual exports, and no governance.
- Poor data quality is expensive: Gartner puts the average at about $12.9M a year.
- Fix it with agreed definitions, one trusted data layer, controlled pipelines, and governance.
- A single source of truth is a governance outcome, not just a tool.
Questions, answered
What is a single source of truth?
Why do our reports never match?
Is this a tool problem or a governance problem?
Is AI making the data-trust problem worse?
What does poor data quality actually cost?
Dr. Ahmed El-Shamy
Co-founder, CEO and Dean of Education, Digisoul
Dr. Ahmed El-Shamy is Co-founder, CEO and Dean of Education at Digisoul. He has more than a decade across AI, fraud risk, and FP&A, and teaches Practical GenAI in FP&A bilingually across MENA, the GCC, and Africa, governed by Digisoul's ISO/IEC 42001:2023-certified AI Management System. Read the leadership profile.
Sources
- Gartner: poor data quality costs organizations an average of about $12.9 million per year. https://www.gartner.com/en/data-analytics/topics/data-quality
- dbt Labs: 2026 State of Analytics Engineering (trust in data 66% to 83%; 71% worry about hallucinated outputs). https://www.getdbt.com/blog/new-dbt-labs-report-finds-ai-driven-acceleration-is-outpacing-trust-and-governance
AI Agent · Built on Claude · Operated on Zoho One